Power Analysis
Like many dirty measurements, I find them interesting to interpret by watching them over time with my Arduino based SensorServer. I've found the voltage dips twice a day, around 5am and 5pm, independent of what I do. Have a look here:
Here is the circuit I use:

I feed this with 12 vac output from a wall transformer. I step this down with a 2k/500 ohm voltage divider, rectify this with a signal diode and smooth with a .1 capacitor in front of an Arduino analog input.
                    +----|>|-----------+-----o to ADC
                    |                  |
       o---/\/\/\---+---/\/\/\---+    ---
 12vac       2k           500    |    --- .1
                                 |     |
       o-------------------------+-----+-----o
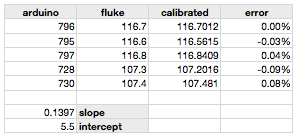
I calibrated this by comparing the ADC to reference measurements made with a Fluke digital volt-meter. I took samples with and without my space heater on so as to bracket a range of values. I fit this data to a linear curve to arrive at this formula:
volts = adc * 0.1397 + 5.5.

The 5.5 offset is presumably due to the diode drop, magnified by the fact that it operates in a voltage-scaled portion of the circuit.
Whole House Power Consumption
I would like to measure my whole house power consumption with high resolution in time and watts. I notice that my power company, PortlandGeneralElectric, is already doing so with a "smart" power meter from Sensus:
JoelWestvold, AMI director at PGE, writes that they see a future where they control my large-load devices so as to equalize the load on their mains: They already control my electric meter which I now know has the ability to remotely disconnect my whole house through 900MHz radio instructions from them through Sensus.I've written to Joel hoping to get access to some of the data he has collected. Until then, I'm measuring my power consumption by periodically clipping a RadioShack ac ammeter around the big wires in my breaker box.
I've found, for the whole house:
- 4,400 watts -- dinner time, with house guests and space heater
- 400 watts -- dead of night, 100 watts of lighting to read meter
Return to WelcomeVisitors